CTO · architecture and backend
oSave
A budgeting app that answers "am I actually financially healthy?"
Most budgeting apps only tell you where the money went. oSave keeps your books with accounting logic, works out six financial-health indicators, gives you a score every month, and tells you what pulled it down.
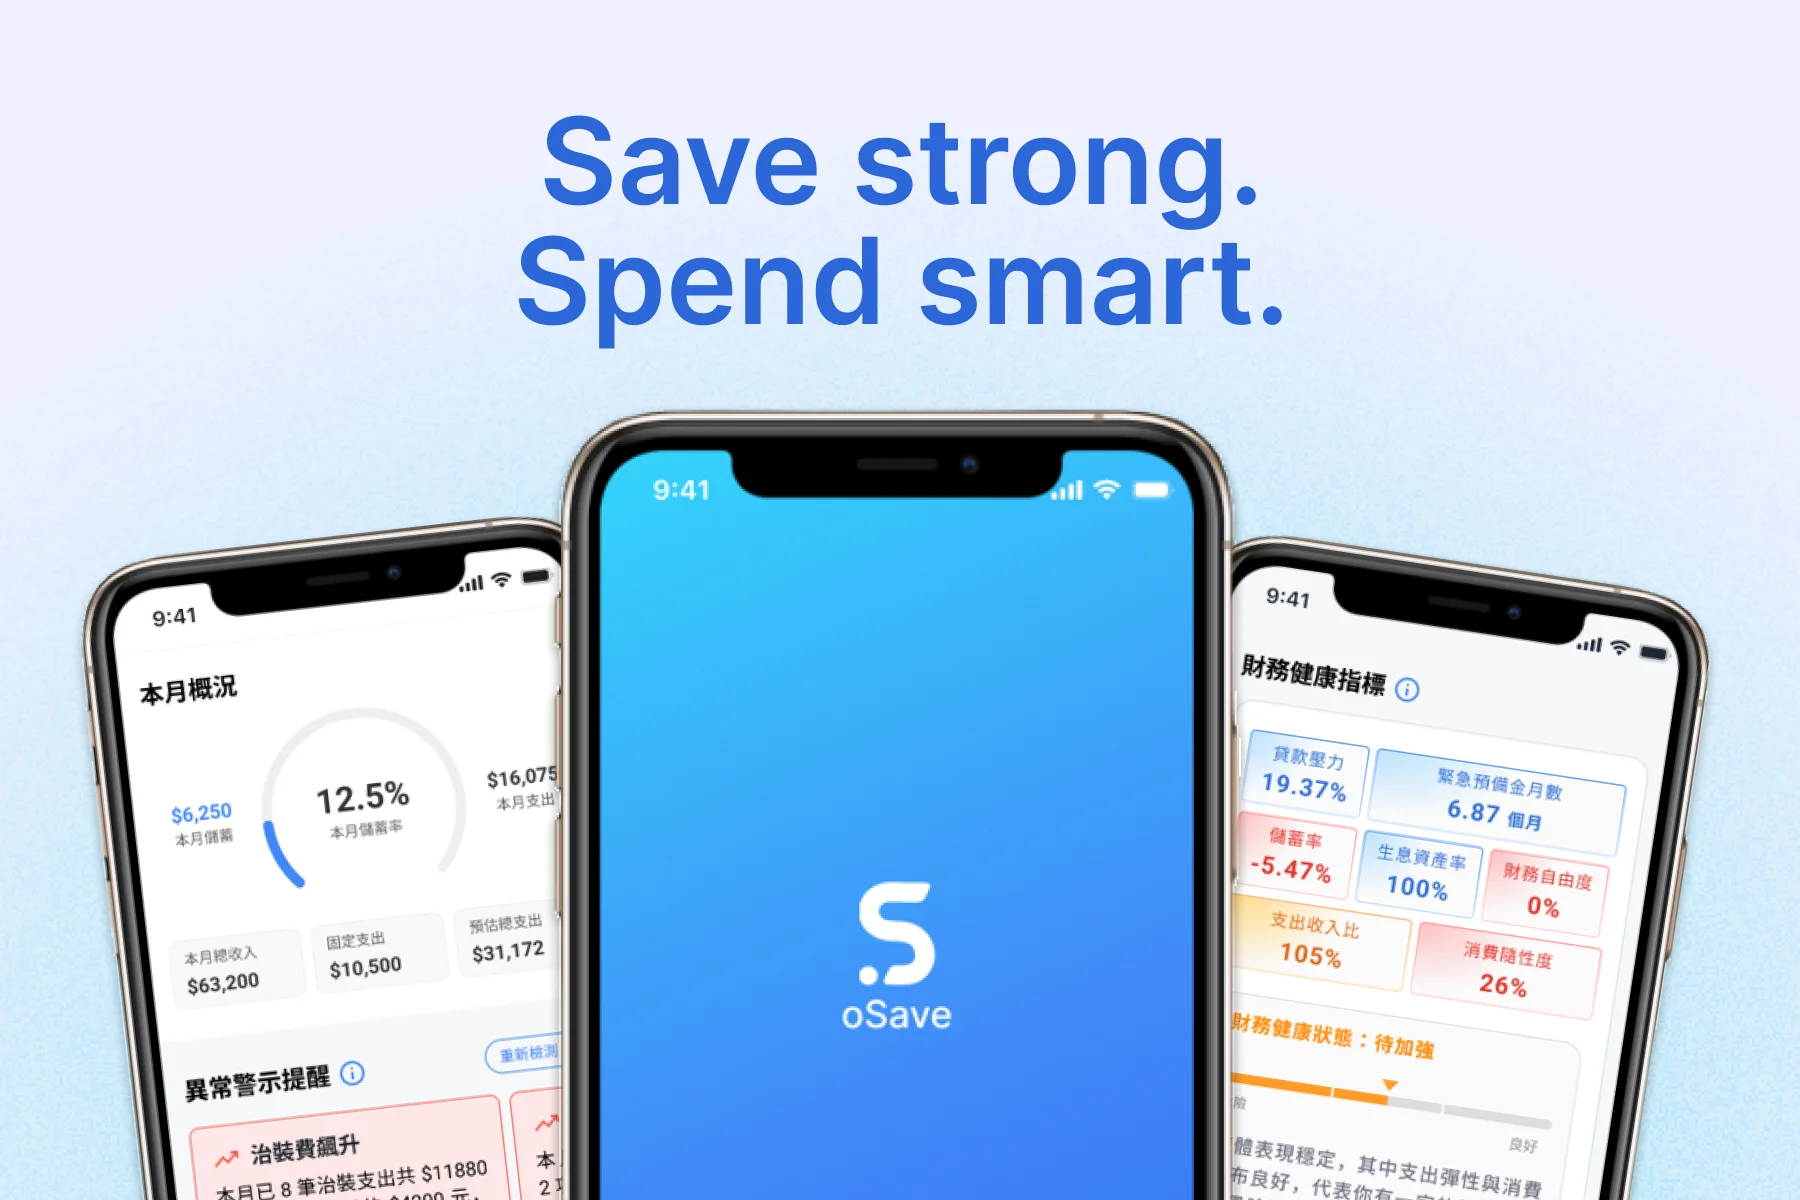
- iOS + Android
- On both app stores
- 8
- Competition awards
- 3
- Top prizes
- U-Start
- Ministry of Education startup grant
What it does

Three taps per entry
Pick whether money came in or went out and how you paid, type the item and amount; the category fills itself in. You never need to know accounting, yet every entry carries its accounting meaning.
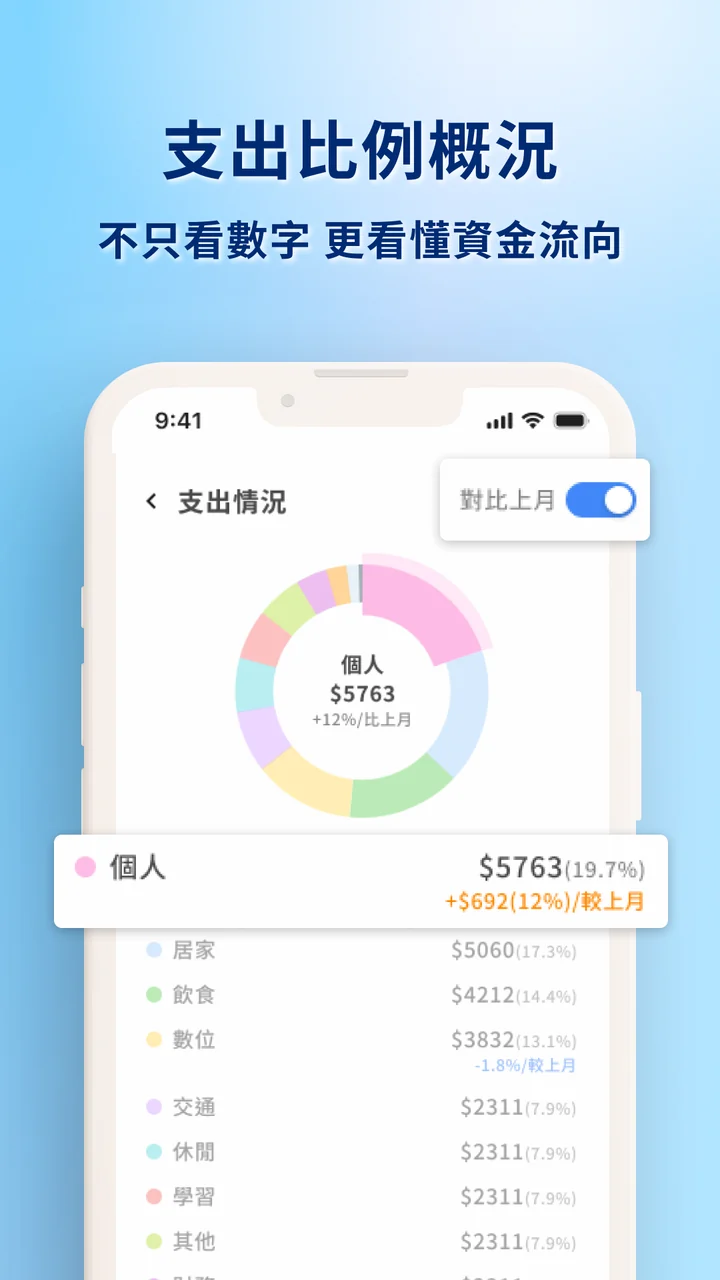
The whole month on one page
Income versus spending, where the money flowed and what it went on, side by side - you can see at a glance where it came from and where it went.
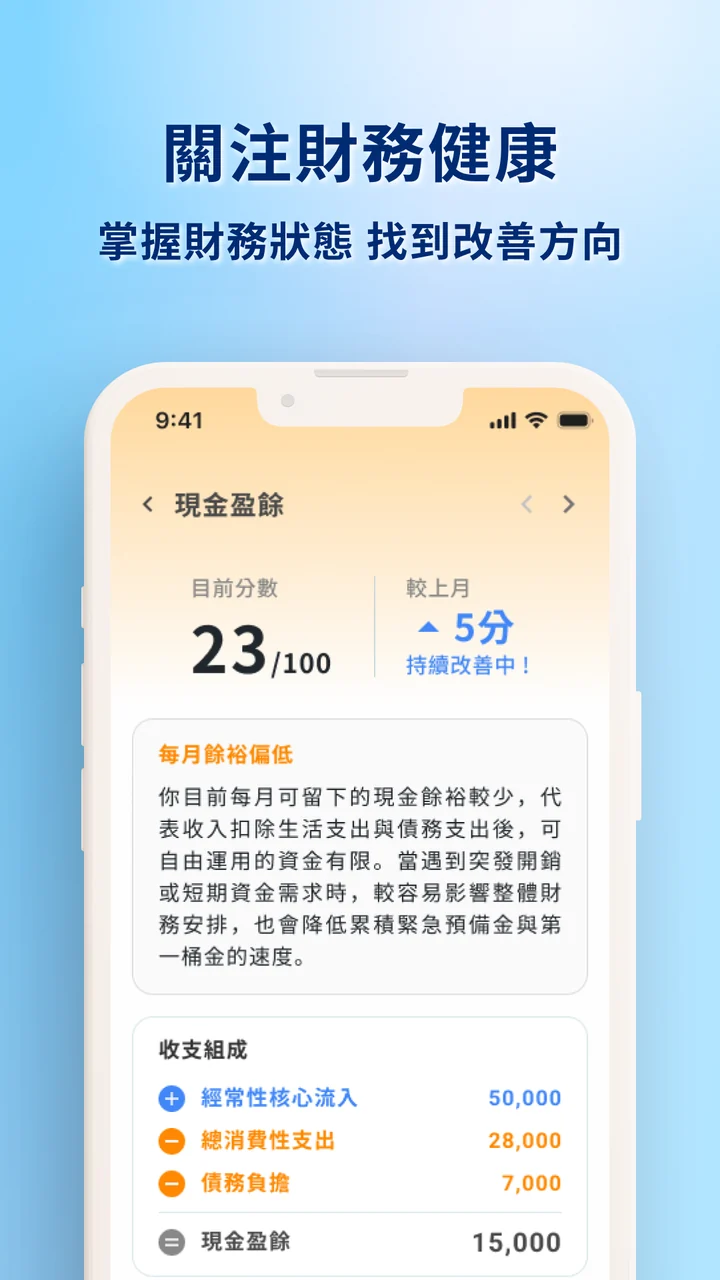
A score, and the reason for it
Six indicators become a 0-100 score, with what needs work and what to keep, plus one sentence on what to adjust next month.
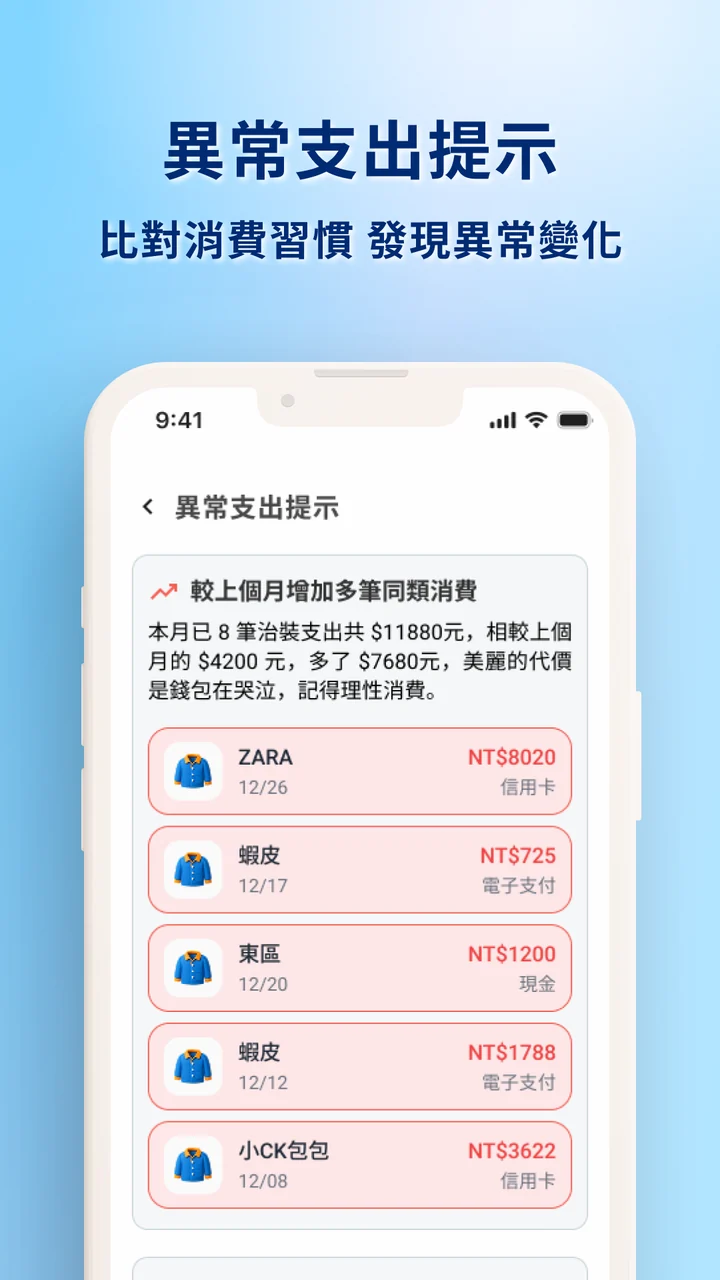
A heads-up when spending looks off
It compares this month with your usual habits; when one category suddenly jumps, it flags it and lists the entries behind it.
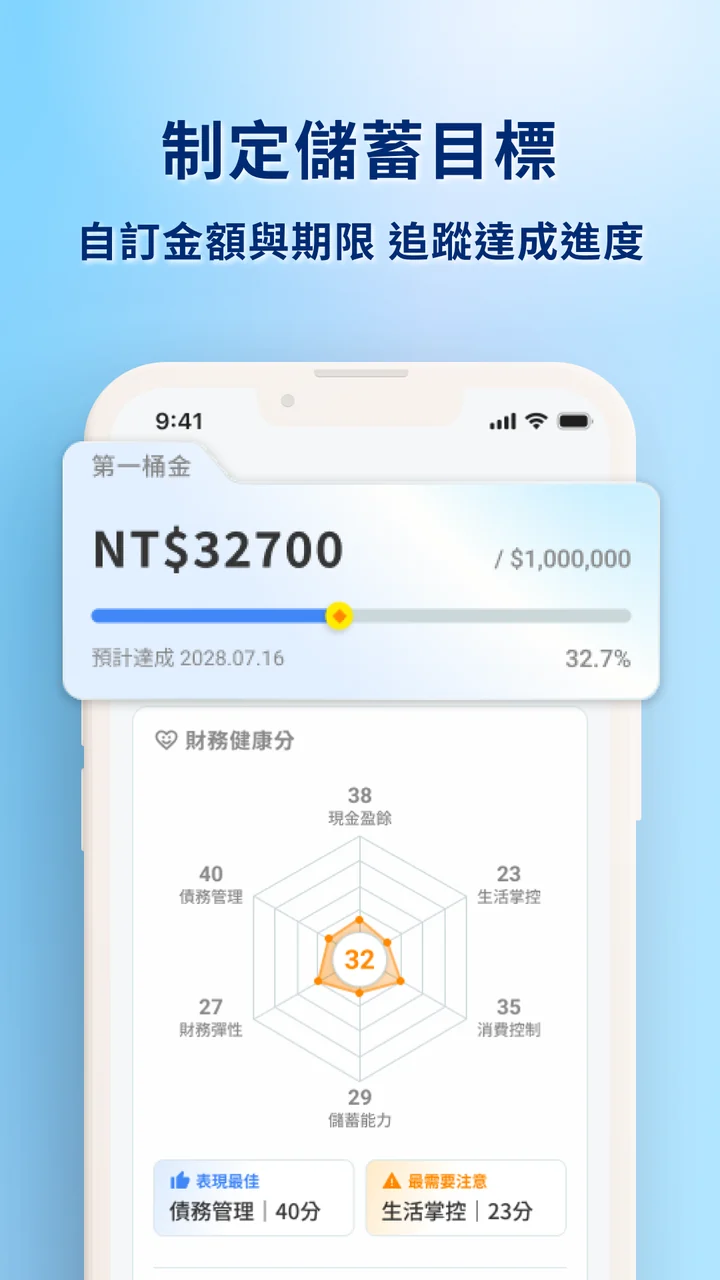
A savings goal you can watch
Set an amount and a deadline; the progress bar moves with every entry and estimates the day you will get there.
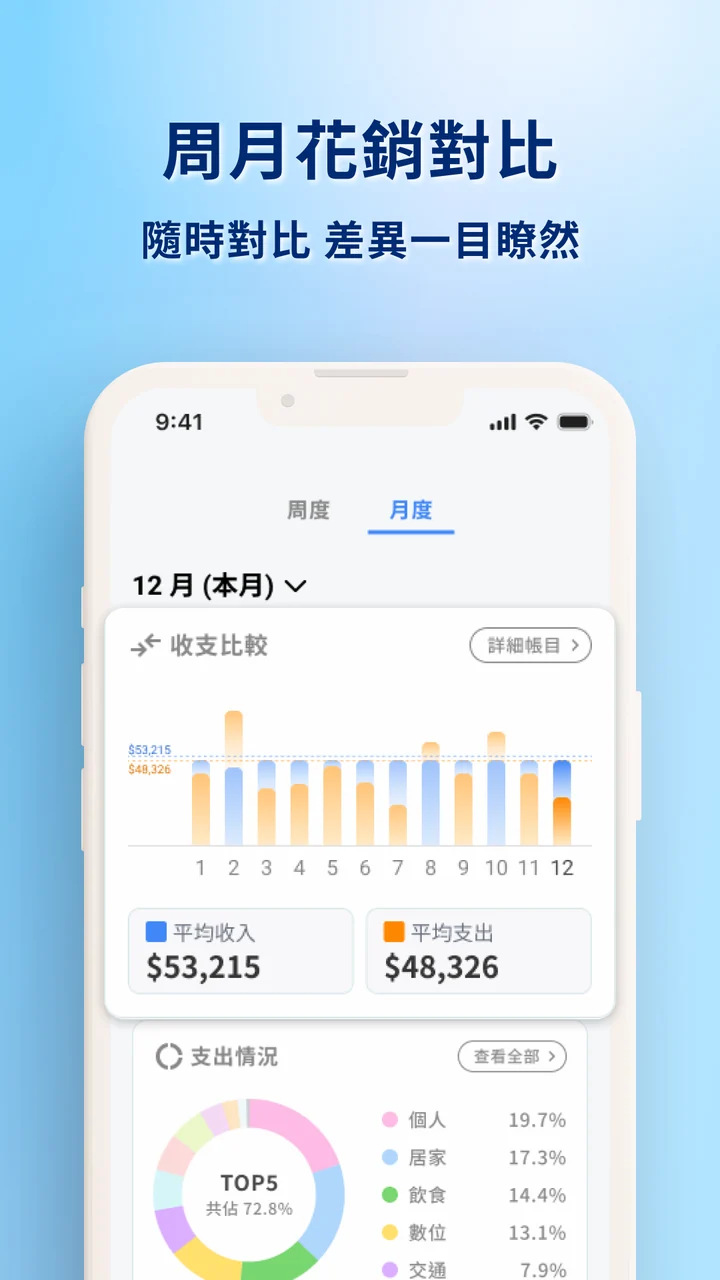
This week against last, this month against last
Switch between week and month and the difference in income and spending is drawn as bars, with no digging through records.
Try it: score a month
Move the money around and watch the six indicators and the score. The weakest one tells you where to start.
Weakest: Wants Treats are a big share of the spending. Pick one category to cap next month.
The six indicators are the ones oSave shows. The thresholds here are round example values; the app scores your own records.
From Invoice Doctor to oSave
The first version, Invoice Doctor, read your receipts and sorted your spending automatically. The data was all there, yet people still could not answer "is this month better or worse?". In May 2025 we changed course - instead of collecting more data, make every entry add up to a conclusion.

What I did
CTO · architecture and backend
- As CTO, led the development team from Invoice Doctor all the way to oSave's launch
- Designed the system architecture and wrote the backend and the financial-indicator calculations
- Built automatic item categorisation - rules first, AI only when rules miss, and a failed guess never blocks an entry
Awards and grants
- 2025.09Taitung Innovation & Entrepreneurship Competition - Best Startup Award
- 2025.027th Social Enterprise Startup Proposal Competition, Rising Star track - Merit
- 2025U-Start Innovation & Entrepreneurship Program 2025 - first-stage selection
- 2024.12Taipei Smart City Youth Policy Proposal Competition - Honourable Mention (4th)
- 2024.11Taiwan Digital Innovation Awards, Digital+ track - Gold
- 2024.09Taoyuan Startup Star competition - finalist (top 10)
- 2024.066th Startup Arena, domestic track - 1st place
- 2024.06Taoyuan Youth Startup Competition - Honourable Mention
- 2024.057th national youth innovation competition, Technology track - Excellence Award
- 2024.01NCU Startup Arena - Merit
Built withFlutter · Dart · BLoC · GoRouter · GetIt · Drift · Firebase Cloud Functions · Python · LLM · Cloud Firestore · Cloud Storage · Firebase Auth · Cloud Messaging · Remote Config · Crashlytics · Codemagic